Connectivity Analysis Using Nilearn
SOE Connectivity Exploration
First, prior to being imported in this script, all the SOE data was pre-processed using AFNI. The EPI scans were all transformed into MNI space, and then I converted these to nifti format and placed them in the directory ‘tmp’. For exploratory purposes, there are only 4 patients included with 72 runs across them.
It seemed natural that one of the first things to do might be see if there are any consistent correlations across all runs.
To start this, we load the file-paths for all the scans.
# Need to load all aligned EPI Scans
import os
func_filenames = os.listdir('tmp')
func_filenames = ['tmp/'+k for k in func_filenames if k.rsplit('.',1)[1]=='nii']
We now have a list with all the file paths. The next step is to load the MSDL atlas which has MNI coordinates for seeds to find different regions.
from nilearn import datasets
atlas = datasets.fetch_atlas_msdl(); # This is an atlas with (x,y,z) coordinates in MNI space for different regions
atlas_filename = atlas['maps']; # Loading atlas image stored in 'maps'
labels = atlas['labels']; # Loading atlas data stored in 'labels'
/home/smazurchuk/anaconda3/lib/python3.7/site-packages/sklearn/externals/joblib/__init__.py:15: DeprecationWarning: sklearn.externals.joblib is deprecated in 0.21 and will be removed in 0.23. Please import this functionality directly from joblib, which can be installed with: pip install joblib. If this warning is raised when loading pickled models, you may need to re-serialize those models with scikit-learn 0.21+.
  warnings.warn(msg, category=DeprecationWarning)
/home/smazurchuk/anaconda3/lib/python3.7/site-packages/numpy/lib/npyio.py:2358: VisibleDeprecationWarning: Reading unicode strings without specifying the encoding argument is deprecated. Set the encoding, use None for the system default.
  output = genfromtxt(fname, **kwargs)
From here, we can create masks from the atlas. This will be done for 10 runs for time. Note: All the confounds (regressors) have been managed by AFNI, so they are not considered by masker. Also, there are many options that could be used such as smoothing
from nilearn.input_data import NiftiMapsMasker
masker = NiftiMapsMasker(maps_img=atlas_filename, standardize=True,
                         verbose=1, memory="caching", memory_level=5)
time_series=[]
for run in range(len(func_filenames)):
    time_series.append(masker.fit_transform(func_filenames[run]))
Now that all the masks are made, we can create correlation matrices for each patient. For these correlations, we can look at the upper triangular and see if any group has a signifigantly increased average correlation from the rest of the groups
import scipy.io as sio
from nilearn.connectome import ConnectivityMeasure
sio.savemat('RawTimeSeries.mat',{'rawTimeSeries':time_series,'labels':labels})
correlation_measure = ConnectivityMeasure(kind='correlation')
correlation_matrix = correlation_measure.fit_transform(time_series)
sio.savemat('corrMats.mat',{'corrMats':correlation_matrix})
# Display the correlation matrix
%matplotlib inline
import numpy as np
import matplotlib.pyplot as plt
from nilearn import plotting
correlation_matrix=correlation_matrix.mean(0)
np.fill_diagonal(correlation_matrix, 0) # Mask out the major diagonal
plotting.plot_matrix(correlation_matrix, labels=labels, colorbar=True,
vmax=0.8, vmin=-0.8, figure=(10,10));
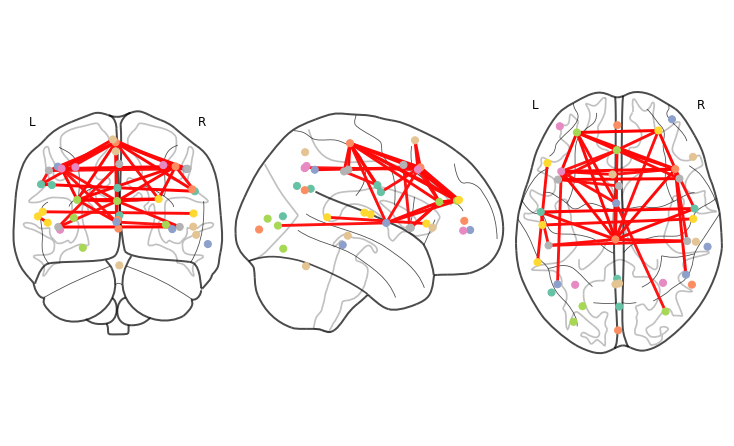
fig=plt.figure(figsize=(10,6))
plotting.plot_connectome(correlation_matrix,atlas.region_coords,edge_threshold="95%", figure=fig);

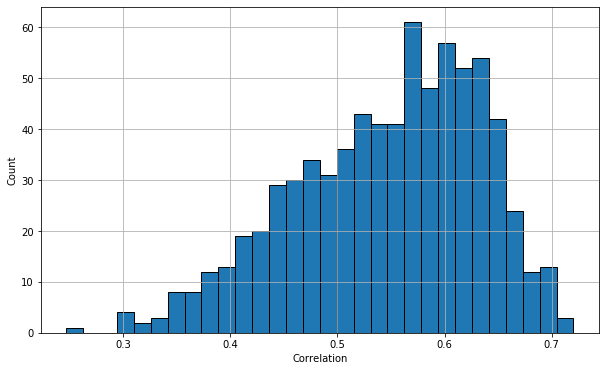
# We could also look at the correlations
import matplotlib.pyplot as plt
data = np.triu(correlation_matrix.data)
data = data[data!=0]
plt.figure(figsize=(10,6)); plt.grid(True)
plt.hist(data,bins=30,edgecolor='k'); plt.xlabel('Correlation');plt.ylabel('Count');
fig=plt.figure(figsize=(10,10))
plotting.view_connectome(correlation_matrix, atlas.region_coords, edge_threshold='95%')
<Figure size 720x720 with 0 Axes>
# We want to at correlations above the 95th Percentile
import pandas as pd
df = pd.DataFrame(columns=['Name', 'Correlation']); cnt=0;
for i in range(len(labels)):
    for j in range(i,len(labels)):
        if correlation_matrix[i,j] > .65: # find max
            df.loc[cnt]=[labels[i]+' __ '+labels[j],
                       correlation_matrix[i,j]]
            cnt+=1
df
| Name | Correlation | |
|---|---|---|
| 0 | L Aud __ R Aud | 0.708733 |
| 1 | L Aud __ Motor | 0.685552 |
| 2 | L Aud __ Basal | 0.661495 |
| 3 | L Aud __ L DLPFC | 0.662773 |
| 4 | L Aud __ D ACC | 0.656200 |
| ... | ... | ... |
| 63 | L TPJ __ Cereb | 0.652361 |
| 64 | R Pars Op __ R Ins | 0.653438 |
| 65 | L Ins __ Cing | 0.665602 |
| 66 | L Ins __ R Ins | 0.712899 |
| 67 | L Ant IPS __ R Ant IPS | 0.679085 |
68 rows × 2 columns